Free
- 27 lessons
- 0 quizzes
- 10 week duration
Overview
Module 1
Module 2
Module 3
Module 4
Module 5
Module 6
Module 7
Module 8
Module 9
RNASeq Pipeline using edgeR
Various Packages using R for Gene Expression
DESeq2 will normalize the counts and parameters based on the number of samples, dispersion,
variation between replicates, etc. Once the analysis is complete save the results in new variable
“res”.
res=results(dds)
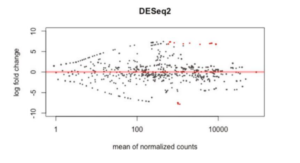
Visualize DE results by creating MA (Fig. 5) and Volcano plots
plotMA(res, main=“DESeq2”, ylim=c(-10,10), alpha=0.1)
For generating volcano plot (Fig. 6) install and load Bioconductor package “a4Base”
require(BiocInstaller)
biocLite(“a4Base”)
require(a4Base)
volcanoplotter(logRatio = res$log2FoldChange, pValue = res $pvalue, pointLabels =
rownames(res), topPValues = 3, topLogRatios = 3)

Prev
Practice
